The remainder of the pandemic (at least until there's an effective vaccine or treatment) will see me exploring a new aspect of astronomy: stellar spectroscopy.
Basically this involves imaging the spectra of stars. In my case I'll start with a diffraction grating mounted on the objective of a cameral lens. The grating produces a spectrum to the side of the star, like this:
I'm using a monochrome CCD camera. If you look closely along the spectrum you'll see little dark gaps in it. Those are real, not artifacts, and denote wavelengths that are being absorbed by the star's outer atmosphere. In the case of Vega it's hydrogen that's doing the absorbing, so the dark lines fall at known hydrogen Balmer wavelengths. These make it easy to calibrate your imaging setup, which is one reason Vega is recommended as the first star to image.
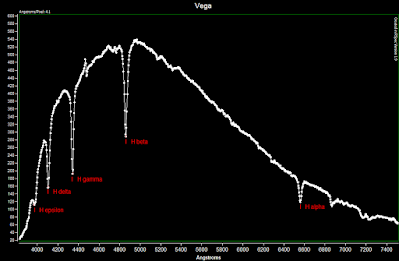
A spectrum like this can be analyzed with software. There are many software titles for doing this, I happen to use RSpec. Here is an example of RSpec output:
(This and all subsequent spectra were made with a 135mm SLR lens mounted on an SBIG ST-8300M CCD camera. An SA-100 grating was in front of the lens objective.)
Five Balmer lines are clearly visible, allowing for fairly accurate calibration. Once calibration is complete it's possible to open a professional-quality spectrum of a star of Vega's spectral classification and use it to create an instrument response curve. This curve can be used to compensate for the way most sensors lose sensitivity away from visible wavelengths.
Once you have your calibration and instrument response done you're off and running. So what can you do? Quite a bit, but there are limits. You can't go too deep with a grating sitting in front of your lens objective; the SA-100 I use clamps the lens down to an objective diameter of only 21mm and your light gathering is greatly reduced. And worse, stars are converted into extended objects so the fraction of light going into the spectrum is spread over many pixels. This means your ability to look at dim objects is going to suffer unless you use long exposure times. (More about this later.)
Even with the limitation of an objective-mounted grating there are still interesting things to be seen with it.
Here is my spectrum of the star Gamma Cassiopeiae:
This is an emission star; it's thought to be surrounded by a decretion disk mainly made of hydrogen. The gas is excited and emits radiation at Balmer wavelengths. Notice at right you can see absorption areas caused by Earth's atmospheric oxygen and water vapor.
You can also get a glimpse of components other planet's atmospheres. Here are my spectra of Saturn and Jupiter:
When looking at a solar system object, you're basically seeing the sun's spectrum with absorption lines added by the planet's atmosphere. For these two gas giants one can see the absorption features in the sun's atmosphere (yellow labels), methane and ammonia in the gas giant's atmosphere (red labels and bars indicating the feature's spectral width) and absorption from the atmosphere of the earth (blue labels).
Presently I'm thinking about building a small collection of spectra for various star classifications. The problem with getting out to the really cool stars is that they tend to be quite dim. My first attempt to collect data for the Garnet Star (class M) required 240 second exposures. I probably should have used something more like 300 or 360 seconds.
On the subject of exposure times, I've made a little graph based on the objects I've observed:
Note this uses a log scale for exposure time. As expected, the required exposure time grows exponentially with magnitude. To get the spectrum of a magnitude 6 star I would need 17 minute exposures; to get down to 8th magnitude it's a 70 minute exposure!
The way around this is to put the grating into the optical path of a telescope objective so that you can take advantage of the larger objective.That will be my next exercise.


No comments:
Post a Comment